How decarbonisation can improve health
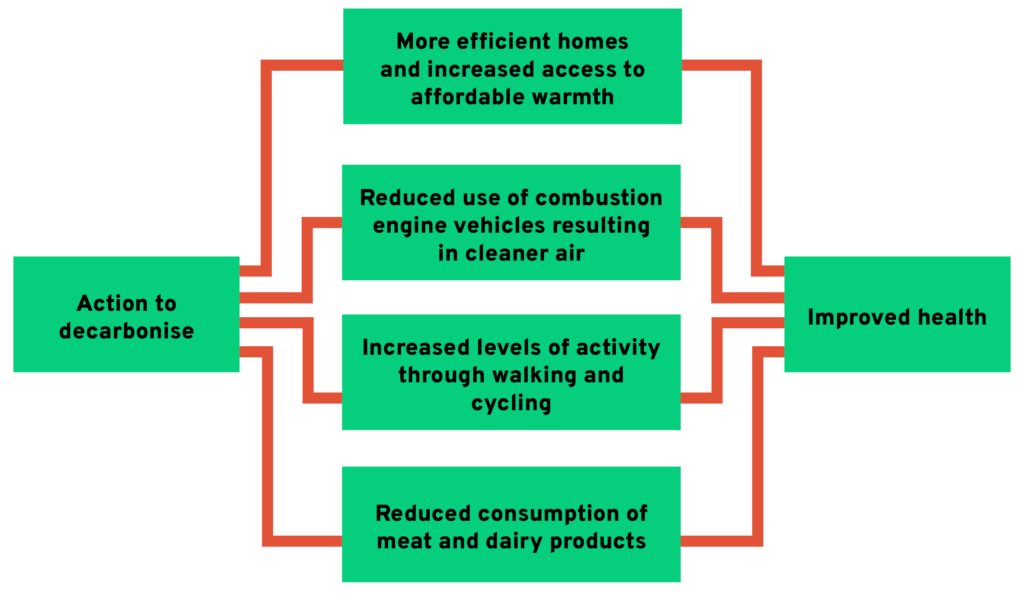
More efficient homes and increased access to affordable warmth, reduced use of combustion engine vehicles resulting in cleaner air, increased levels of activity through walking and cycling, and reduced consumption of meat and dairy products.
Taking action to decarbonise can have significant beneficial effects on people’s health through improved air quality, improved access to warmth during the winter and from increased activity from walking or cycling rather than using motorised transport.
Key facts
- Particulate matter and nitrous oxides contribute to around 40,000 air pollution-related deaths per year in the UK.
- Physical inactivity is responsible for 1 in 6 deaths in the UK and costs the UK £7.4bn annually, including £0.9bn to the NHS alone. Active travel can help promote better health by increasing levels of physical activity
- Poor quality housing costs the NHS £1.4bn a year, £857m of which is caused by excess cold.
- Access to and spending time in green space helps lower anxiety levels.
- Stress and anxiety amongst young people living in urban areas are reduced by 14%-19% after a 15-minute walk in a park or by 23%-31% by a 15-minute walk in a forest. Young people with high levels of vegetation within 500m of their home have reduced risk of depression and anxiety.
- Extreme weather events, such as heatwaves and flooding, have significant health impacts. UK heatwaves in summer 2020 resulted in an estimated 2,556 excess deaths (not including those caused by COVID-19).
- If the average dietary intake in the UK complied with the recommendations of the World Health Organisation, a reduction in greenhouse gas emissions of 17% could be achieved.
- The Climate Change Committee’s Sixth Carbon Budget analysis reported that the health benefits of active travel, uptake of low-carbon vehicles and a shift towards less meat-intensive diets could generate combined annual benefits of over 0.6% GDP.
Accessing facts that relate to your area
Previous Section:
Chapter 3 – Health
Next Section:
3.2 Business case